Student pollsters gather, summarize, display, and analyze their opinion poll results. What more could you ask?
1.
Kids' opinions count! Find out your schoolmates' choices in a weekly opinion poll. Feature results on a bulletin board that you design, build, and manage. Some topics you might survey: tastiest school lunch item, school uniforms, favorite way to exercise. Each week, choose one question and the group you will ask. Here are a few suggestions to get your survey team started.
2.
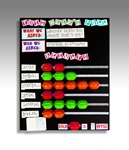
<STRONG> Set up the bulletin board</STRONG>. With Crayola® Scissors, cut craft paper to cover a bulletin board. Create four signs: your display title, "What we asked," "Who we asked," and "Results" with Crayola Gel Markers. Attach signs at the top of the bulletin board with a Crayola Glue Stick.
3.
Leave the bottom left side of the bulletin board blank to list poll choices. Attach long pieces of hook and loop tape the rest of the way across. Attach small pieces of tape to several clean recycled plastic containers so they can be used as symbols to represent votes for each choice.
4.
<STRONG>Take your poll</STRONG>. Gather information for your first poll in a notebook. Write the poll question and choices with Crayola Erasable Colored Pencils. Visit classrooms, lunch tables, or groups of children at recess to ask your question. Tally each vote.
5.
<STRONG>Show your results</STRONG>. Make signs with the poll question and the name of the group(s) you polled. Attach to the top of the board.
6.
Add your tally marks and construct a graph to show the data. Write labels on paper strips and attach to the left of each tape strip. Decide how many votes each snack cup represents. Attach snack cups on the tape strip. Analyze the poll findings. Were you
Build bridges and friendships! Plan and construct a bridge with this constructive lesson that’s inspired by a Maya Angel
Have fun with your friends and family when you ask for the juice naranja or point out your sneakers blanc. Design and pl
Showcase children’s family heritages and traditions with bright colors and distinctive patterns. These individual, no-se
See the world in a new way--with the breads people eat. Explore cultural attributes and world populations with a pictogr
Work together to weave a multicolored basket with Crayola Model Magic® Naturals. Fill it with words that celebrate diffe
Explore the wonders of ancient Egypt then construct a 3-D pyramid on which to display your findings.
What feels better than lending a hand to a good friend? Share your great ideas as you work with a partner to design a fu